The leading API for granular electricity data
Electricity Maps provides actionable electricity data for more than 230 regions. We help businesses more effectively reduce their emissions, and enable products and services to differentiate their offerings by empowering end-users to be more carbon-aware.
Get started with a free trial for our commercial API, check out open historical data on the Data Portal or see our data visualized on a live map in our free app.
Want to preview our data? Visit the App


Our customers use Electricity Maps data across numerous industries and a wide variety of use cases. The data can be integrated with apps, smart devices, software (e.g. Saas products), and carbon accounting processes.
Increase user engagement and flexibility using real-time electricity data on B2C interfaces.
Reduce costs and emissions by optimizing flexible systems to use electricity when it is clean and cheap.
Create granular carbon footprint reports for business customers or your own organization.
Electricity Maps offers a data platform with access to carbon emissions and electricity sources data.

Electricity Maps offers a broad range of data including carbon intensity and the full power mix of electricity consumed in a region—all available historically, in real-time, and as forecasts.
%201.svg)
We offer data for more than 200 regions and 50+ countries worldwide. We are continuously expanding our geographical coverage, to continue providing the most comprehensive data on the world’s electricity.

With leading domain expertise and a dedicated global community of contributors, we offer the most accurate and highest-quality data. We continually work to improve data quality and ensure maximum transparency in the process through our open-source and scientific approach.
Our API offers a single source for accessing electricity data from around the world.
This streamlined access simplifies integration with existing solutions or the development of entirely new ones. One single API access provides endless opportunities - whether you want to feed our data into an existing product or build insightful dashboards from scratch.
The API delivers data on carbon intensity and the power breakdown of electricity production and consumption with hourly granularity. We use a peer-reviewed methodology, using flow tracing to trace back the true origin of electricity and account for life-cycle emissions of electricity production.


Learn more about how our clients and partners use our data, and hear what they have to say about Electricity Maps.
.png)
Driven by ambitious sustainability goals, Google’s Climate Operations team partnered with Electricity Maps to reduce its carbon footprint and enable other companies to do the same.
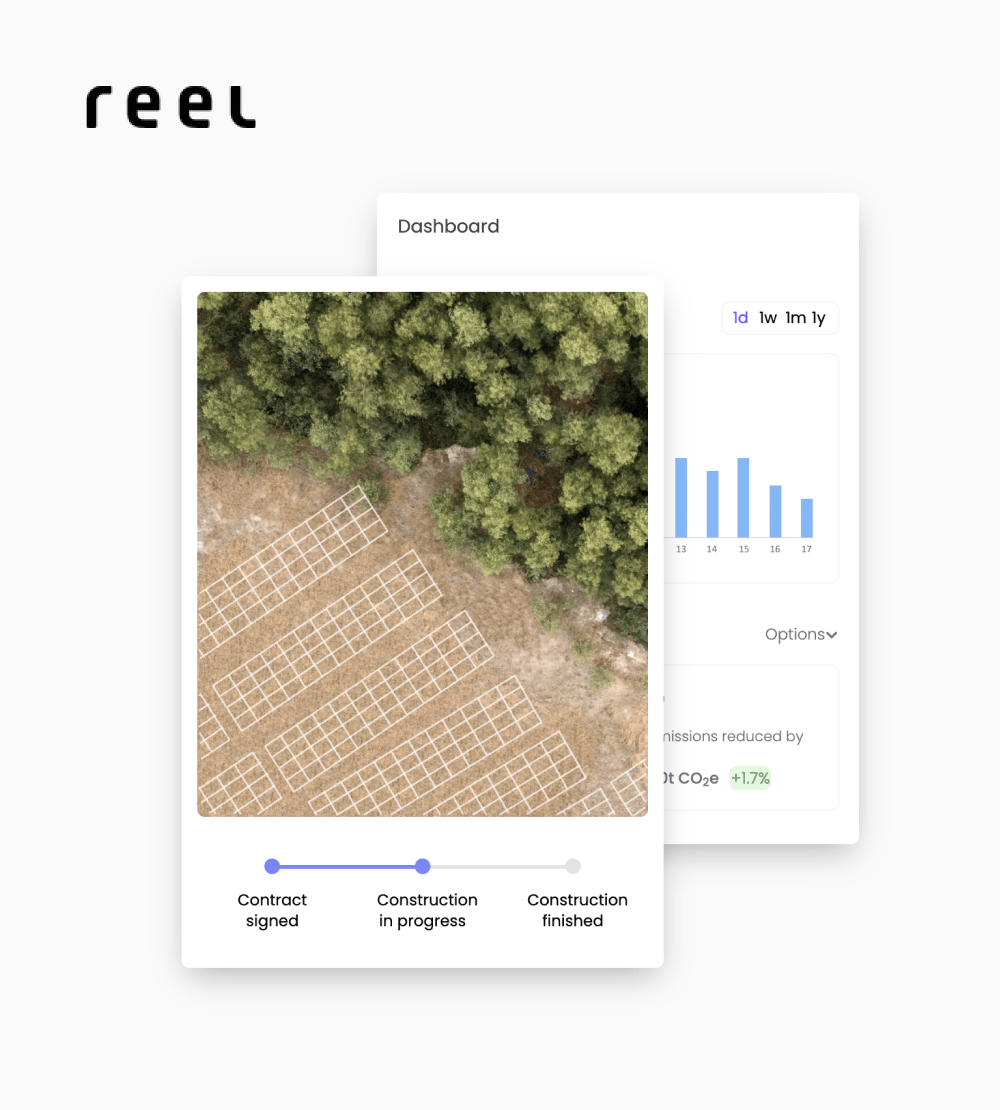
Reel transforms the procurement of sustainable energy for companies. With 24/7 data from Electricity Maps, Reel enables companies to truly take action against climate change
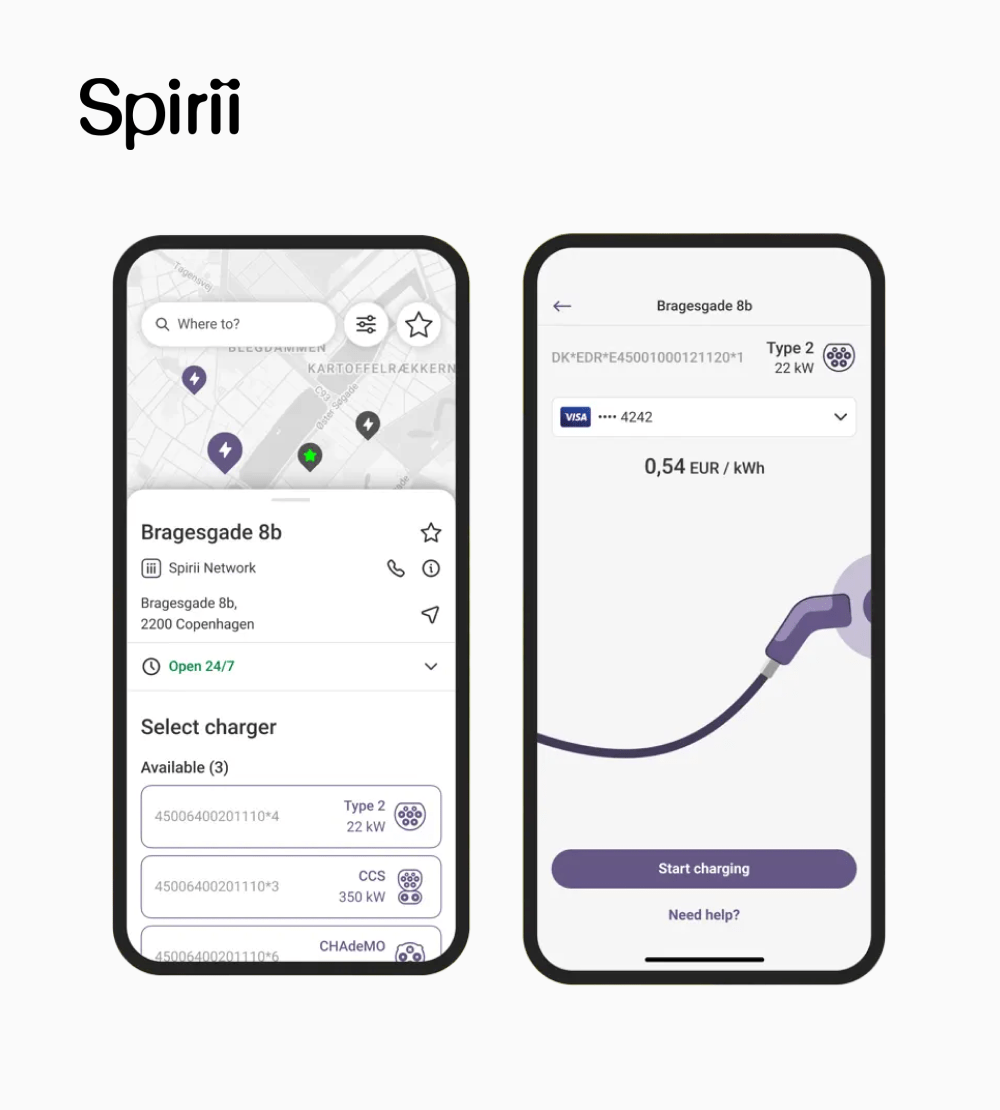
Spirii is an EV charging and business management platform that allows businesses to offer seamless charging experiences.
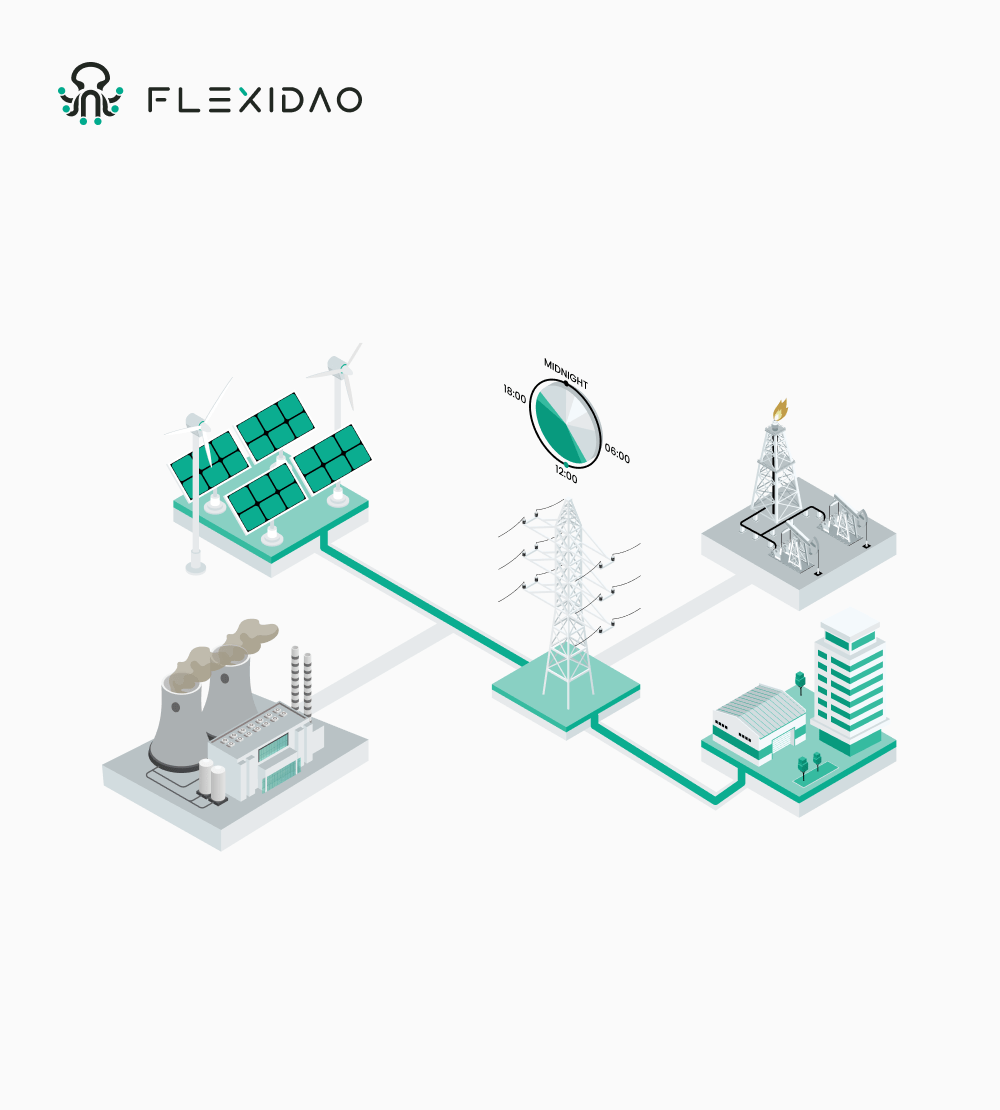
FlexiDAO supports companies, energy buyers, suppliers, and consultants in guiding them in their transition from buying yearly energy certificates to 24/7 energy matching.